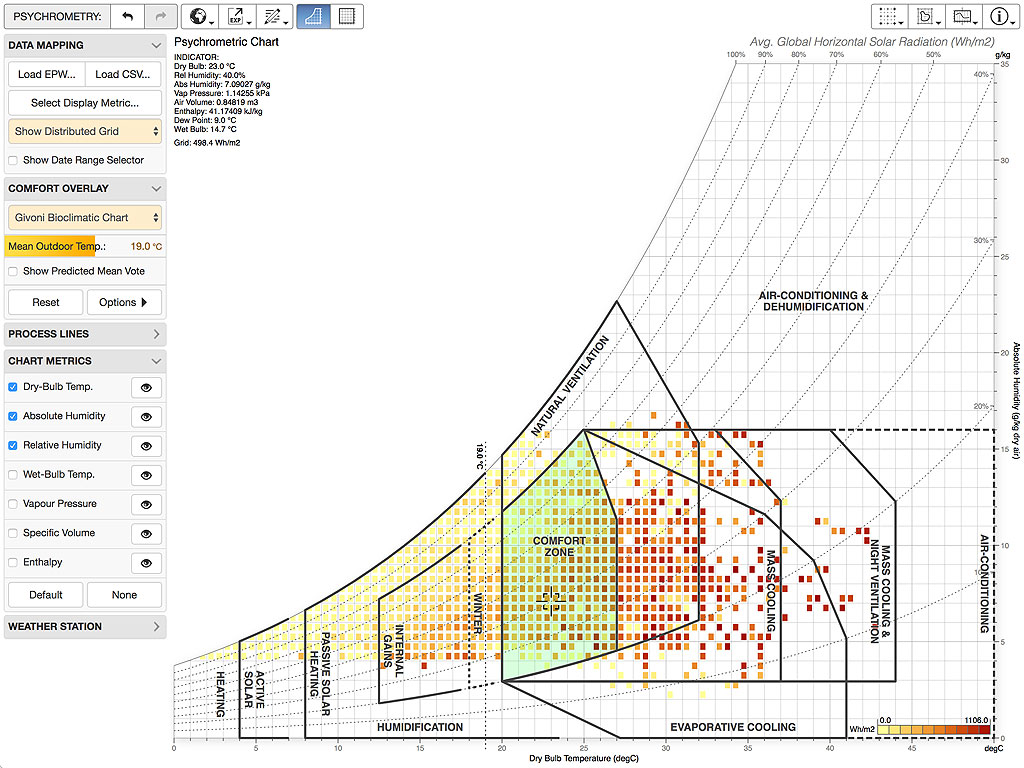
This web app displays a psychrometric chart on which you can overlay a range of comfort metrics and psychrometric process lines, as well as loading and viewing EnergyPlus/OpenStudio weather data (.EPW) and output files (.CSV). It smoothly transitions between absolute humidity and relative humidity in the vertical axis to clearly demonstrate why the psychrometric chart is such a useful representation, and to illustrate the core relationships between the Givoni and Olgyay bioclimatic charts. You can also generate ASHRAE Standard 55 and EN-15251 comfort analysis diagrams for inclusion in reports.